--By Bikram Chitrakar
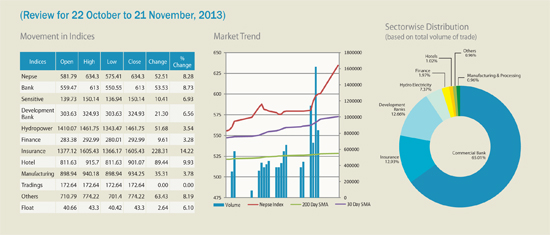
Nepal’s secondary market skyrocketed to 4-years high during the review period as Constituent Assembly (CA) election heated the sentiments. The benchmark Nepse index surged 52.51 points or 8.28% to rest at 634.3. Session’s high was 634.3 on 21 November and low was on 28 October with 575.41.
The local stock market of Nepal propelled to 4-years high on November 21, crossing the 630.11 mark recorded on 8 September, 2009. Early results of the CA elections held on November 19, showed that democratic forces, positive to the stock market and free market economy, were coming to the power and this boosted optimism of the investors.
However, the positive sentiment was visible even before the CA elections were held. On 13 November, Nepse Index had posted 600.07. But on November 21, the first trading day after polling, there were three circuit breaks. The market meter table also shows growth in all sub-indices, market capitalization and float market capitalization.
Quarterly financial reports, dividend declaration season and lower market rates were various factors that grabbed attention of investors toward capital market, and pushed the turnover up. Hence market is likely to enjoy historical level in the upcoming sessions.
Performance by Sector
Insurance sector gained heavy from 228.31 points or 14.22% to rest at 1605.43. Hotel sector registered the growth of 89.44 points while other sectors gained 63.43 points to 774.22. Commercial bank accelerated 53.53 points followed by 51.68 points up in hydropower sector. Development bank moved higher by 21.30 points or 6.56% to rest at 324.93.
Sensitive index that measures the performance of 120 blue chips went uphill from 10.41 points or 6.93% to 150.14. The float index, calculated on the basis of real transaction, accelerated 2.64 points or 6.10%. Total of Rs. 2,930,437,274 turnover was realized during the review period from 11,291,309 units of shares traded via 32,371 transactions.
The accompanying figure shows sector-wise distribution based on the total volume of trade. As usual commercial bank dominated the total volume of trade holding 65.01%. Insurance sector grabbed 12.93% while development bank accounted for 12.66%. Remaining portions were covered up by rest of the sectors.
Technically, the Simple Moving Average (SMA) indicates wide growth in short term (30 days SMA) while 200 days SMA is flat over index. Key resistance test in the level of 625 is likely to occur for further skyrocketing.
(Chitrakar is a Stock Analyst with Jamb Technologies Pvt Ltd.)