Market Trend
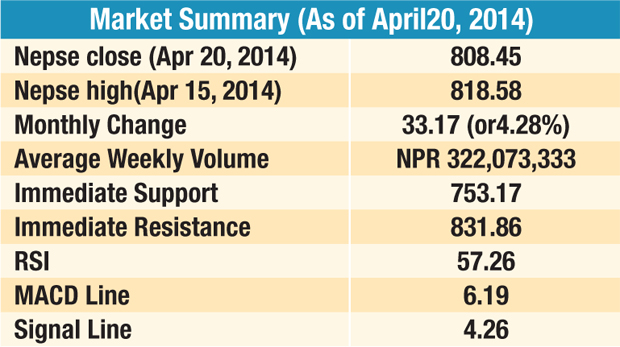
During March 21 to April 20-2014, Nepal Stock Exchange Index (Nepse) made a remarkable gain of 33.17 points (or 4.28%) to end on a positive note. After steep selling witnessed during the previous trading period, investors jumped back into the market looking for good buy. The increased buying brought in additional demand which helped prop up the secondary market. Nepse, the benchmark index of country's capital market, climbed above the 50-day moving average and has managed to stay above the line. The index has not been able to break above the resistance level of 831.86 set on Feb 23, 2014. Thus this level will pose as a strong hurdle for the market index while moving up. Once the market breaches above this level, the bull rally should gather extra steam. The 50-day moving average has currently been acting as a short-term support for the market.
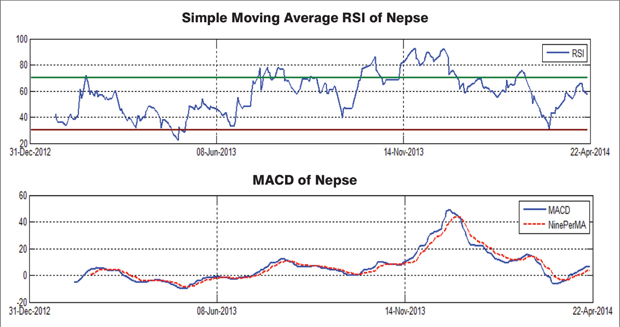
Relative Strength Index (RSI)
Relative Strength Index is one of the leading indicatorsof technical analysis that is believed to be most effective during periods of sideways movement of market. Such indicators may create numerous buy and sell signals that are useful when the market is not clearly trending upwards or downwards. On March 18-2014, the RSI reached its lowest point in recent times when it closed at 30.65 levels. This had indicated that the market was on a verge of oversold region, which brought in demand for stock in the secondary market. As of the last trading day of the review period, the RSI stood at 57.26 levels. The RSI hovering in the neutral zone indicates a balanced supply and demand scenario in the near term.
Moving Average Convergence Divergence (MACD)
The MACD is a momentum oscillator formed by using two different types of moving averages, which provides specific buying or selling signals. When a MACD line crosses above the signal line, it isconsidered to be a positive sign and indicates a time to buy, and vice-versa. Currently, the MACD line and Signal line standat 6.19 and 4.26 points respectively which indicate that the overall momentum of the stock market has been in an upward trend. However, in the last week, the momentum has slightly shifted and is moving in the sideways direction.
Bollinger Band
The Bollinger Band is a technical indicator that consists a moving average of 21-dayalong with two trading bands an upper bandand a lower band. The bands are an indication of volatility, which are represented by calculating standard deviation of index. Nepse touched the lower band on March 17, 2014 citing an oversold condition. Since then, it began upward trend and made a slight contact at the upper band indicating a slight overbought condition in the near term. The decreasing volume in the current scenario suggests that there may be some minor decline in the near term. However, the longer-term view remains positive.
End Note
After the 5.76% decline witnessed in the earlier period, Nepse made a strong recovery to end at 808.45 points, an increase of 33.17 points or 4.28% for the review period. Nepse is maintaining above its 50-day moving average, a strong support level, is a positive sign for the market. Investors will need to keep a close eye on the nearest resistance level of 831.86 points. As of the last trading day, RSI stood at 57.26 levels, which indicate that the market is relatively in a stable zone. The MACD indicator still represents a longer-term positive trend with greater upside potential. The Bollinger Bands illustrate a slightly overbought situation in the near term but a positive longer-term view. All these indicators point to a fairly neutral market with possibility of minor declines in the near term. However, the long-term market scenario remains bullish.