Market Trend

RSI

RSI is a form of leading indicator that is believed to be most effective during periods of sideways movement. Such indicators may create numerous buy and sell signals that are useful when the market is not clearly trending upwards or downwards.
During first half of the period the RSI hovered around the 30 levels. It reached 29.41 levels at the end of March, indicating a buy signal. However, during the second half, it went up and headed towards the 40 levels, maintaining a neutral stance. Currently the RSI stands at 39.39 levels at the last trading day.
MACD
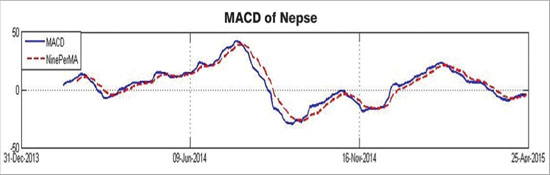
The MACD is a momentum oscillator formed by using two different types of moving averages, which provides specific buying or selling signals. When a MACD line crosses above the signal line, it is considered to be a positive sign and indicates a time to buy, and vice-versa.
The MACD line remained at the negative zone throughout the period. It was below the signal line during the first half of the period. However, by the other half of the period, the MACD line crossed above the signal line, implying a bullish trend. Currently the MACD and signal line rests at -4.43 and -5.08 respectively.
Bollinger Bands
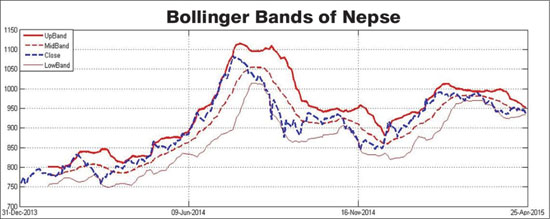
The Bollinger Band is a technical indicator that consists of a moving average (21-day) along with two trading bands above (upper band) and below it (lower band). The bands are an indication of volatility, which are represented by calculating standard deviation.
Nepse moved along with the lower band during the first half of the month. However, during the other half of the month, it moved closely with the mid band, indicating neutrality. The upper and the lower bands have converged significantly, suggesting a decrease in the market volatility.
Overview
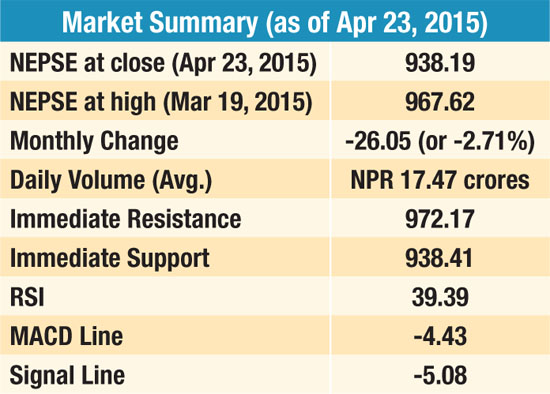
The fall experienced by Nepse in the past 30 days is much more as compared to the drop witnessed in the month prior. Nepse decreased by 26.05 points (or 2.71%) to close at 938.19 points. It also dipped slightly below the support level of 938.41 during the middle of the month. Currently, it has ended closely with its support level of 938.41. If it makes a significant fall below the current support level, the next closest support level stands at 919.88. The 50-day moving average is converging with the 200-day moving average. Nevertheless, the 50-day moving average is still above the 200-day moving average suggesting that the overall view of the market remains positive. The average market volume fell to NPR 17.47 crores compared to the average volume of NPR 22.00 crores the month prior. After hovering around the 30-levels during the beginning of the period, the RSI currently stands at 39.39 level, maintaining a neutral position. Presently, the MACD line is above the signal line and rests at -4.43, which is higher than the period’s average of -5.78. The upper and lower Bollinger bands are converging, indicating low market volatility. The trend shows that this is the period where the market is experiencing least volatility over the past one year.