Bullish New Investors

Nepse Figure
Trend Analysis
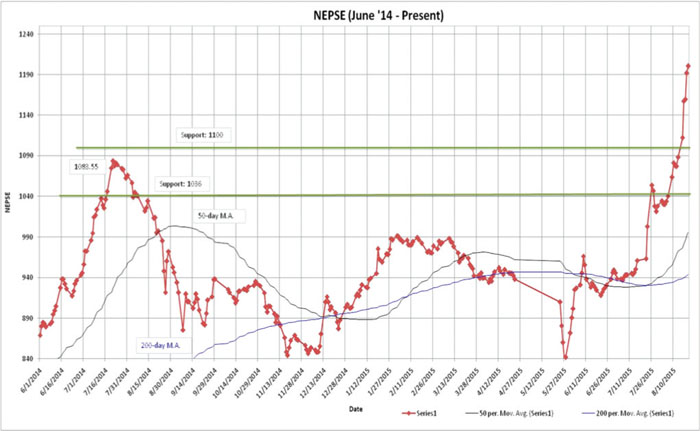
Nepse witnessed remarkable gains in the course of last month. The benchmark index rose by 197.54 points (or up 18.31%). It surpassed its previous resistance levels of 1036.98 and 1100 points and is moving well above the 50-day and 200-day moving average, and at a much higher rate, indicating a bullish outlook. The 50-day MA also surpassed the 200-day MA, showing that the overall market trend looks positive. This fresh bullish momentum in the market was triggered by the monetary policy announcement, which took place during the beginning of last month. Towards the end of the month (19th August), the Nepse index created history by breaking its all time high index of 1175.55.
Resistance and Support
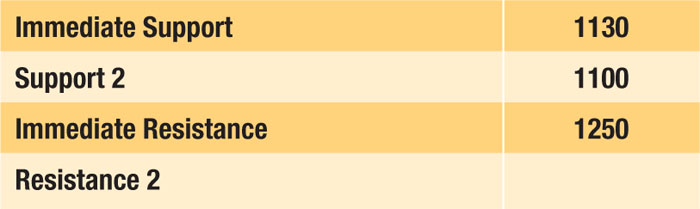
The lowest Nepse went down to last month was 1021.33. During the course of the month, the index made some notable gains reacting to the monetary policy announcements. The benchmark index crossed over two of its resistance level of 1036.98 and 1100, towards the end of last month. The market shows high buying pressure of commercial banks as a result of the NRB directives. The bullish trend is likely to continue since commercial banks cover more than 50% of total market capitalization. Its current support and resistance level now stands at 1130 and 1250 respectively.
Nepse Trend Indicator
a. MACD
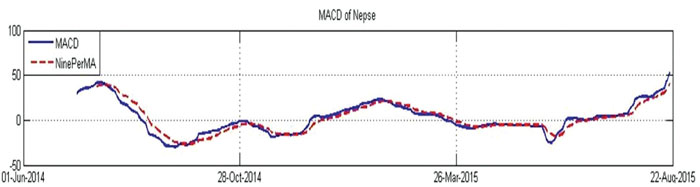
The MACD is a momentum oscillator formed by using two different types of moving averages, which provides specific buying or selling signals. When a MACD line crosses above the signal line, it is considered to be a positive sign and indicates a time to buy, and vice-versa.
The Macd and signal lines experienced vast changes in the course of last month. The lowest level of Macd and signal line during the beginning of the month was 17.78 and 8.51 respectively. Throughout the month, both the lines increased significantly. The market still triggers a bullish momentum as the Macd line is moving well above the signal line. By the end of the month, the macd and signal lines ended at 52.61 and 40.27 respectively.
b. RSI
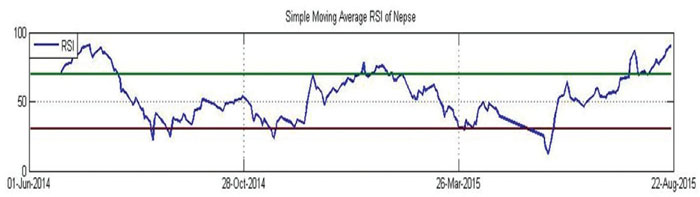
RSI is a form of leading indicator that is believed to be most effective during periods of sideways movement. Such indicators may create numerous buy and sell signals that are useful when the market is not clearly trending upwards or downwards.
At the beginning of last month, the RSI reached its high level of 86.85, reacting to the aftermath of the monetary policy announcement. Throughout the month, RSI hovered around an average of 78.19 level, signifying high overbought condition in the market. A bullish momentum in the market has created high buying pressure from the investors. Currently, the RSI stands at 90.09 level.
c. Bollinger Bands
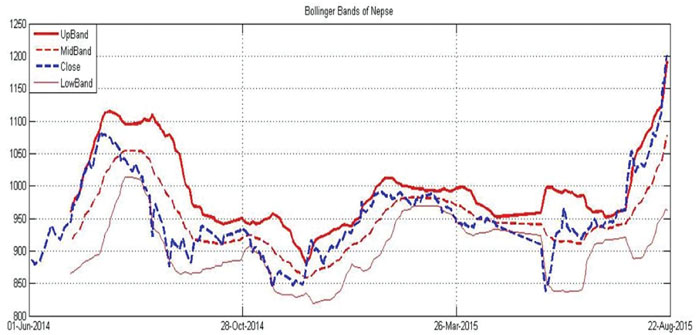
The Bollinger Band is a technical indicator that consists of a moving average (21-day) along with two trading bands above (upper band) and below it (lower band). The bands are an indication of volatility, which are represented by calculating standard deviation.
For the first half of last month, the benchmark index moved above the upper Bollinger band, showing high buying pressure in the market. For the rest of the month, the index hovered just below the upper band. However, towards the end of the month, the benchmark index climbed just above the upper band. Last month also saw a significant increase in the market volatility, as the upper and lower bands have gained distance from each other.
Volume Indicator (On-Balance Volume)
On-Balance Volume (OBV) is a momentum indicator that relates volume to the current price of the index or security. It measures buying and selling pressure at the market. It acts as a cumulative indicator that adds volume on up days and subtracts volume on down days. If a price increase is supported by OBV, it confirms an uptrend, whereas if a price decrease is supported by OBV, it confirms a downtrend.

Last month, the On-Balance Volume (OBV), increased along with the increase in the Nepse index. This supports the bullish trend present in the market. The average monthly volume transactions increased to a staggering NPR 63.70 crores from NPR 29.71 crores the month prior. There has also been a steady increase in volume transaction over the past few weeks. This shows that new investors are entering the market, causing high buying pressure as a result of the monetary policy announcement.
Overview
The Nepse index made remarkable gain of 197.54 points (or up 18.31%) in the course of last month. Nepse, at the beginning of the month, was at 1053.95. Announcement of the monetary policy triggered a bullish momentum, causing the index to surpass its all time high of 1175.38 towards the end of the month. The 50-day MA also crossed over the 200 day MA. Furthermore, the benchmark index is above both the mentioned moving averages, and is moving up at a higher rate as compared to the moving averages. The average monthly volume transactions increased to a staggering NPR 63.70 crores from NPR 29.71 crores the month prior. This shows that new investors are entering the market. The increase in the index is also supported by the OBV, indicating a bullish trigger. The RSI ended at 90.09, signifying high buying pressure in the market. The Bollinger bands show prevalence ofa volatile market. The new support and resistance level stands at 1130 and 1250 respectively.