Nepse Added 114 Points
Nepse Figure

Trend Analysis
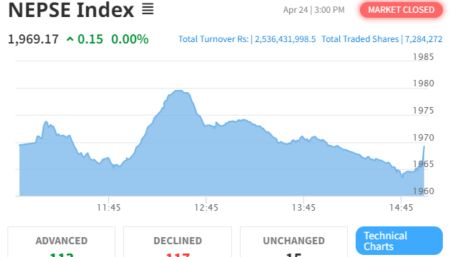
The benchmark index saw huge changes in the course of last month. Despite all the difficulties and political unrest in the country, Nepse gained a staggering 114.26 points (or up 11.17%) to close at 1137.03. It seems that the monetary policy is still playing a major role in causing the market to be bullish. The index went down to its lowest level (1022) at the beginning of the month, where the 200-day moving average (MA) acted as its support level. Towards the end of the month, the index moved above the 50-day MA, indicating a bullish presence in the market. Majority of the gains experienced by the index was due to the capital plan increment for insurance sector, which caused a hike in the demand for insurance companies. Furthermore, book closure date for attractive microfinance bonuses also hiked up the prices of microfinance banks.
Resistance and Support

The benchmark index reached a height of 1205 in the previous months. Due to numerous political unrests, the index crashed down to 1022 level. However, it bounced back up to 1122 level, and after that the market corrected itself to 1110 level. Nepseclimbed back up, following a bullish move up, and crossed above the resistance level of 1130. Currently, the immediate support level stands at 1130 and the immediate resistance level stands at 1160 level.
Nepse Trend Indicator
a. MACD
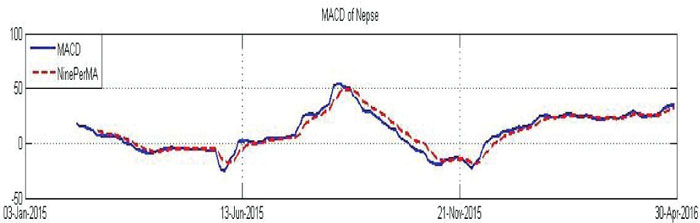
The MACD is a momentum oscillator formed by using two different types of moving averages, which provides specific buying or selling signals. When a MACD line crosses above the signal line, it is considered to be a positive sign and indicates a time to buy, and vice-versa.
The Macd and the signal line, at the beginning of the month,stood at -21.89 and -17.10 respectively. Since the beginning of the month, both the lines have risen steadily. The first half of the month saw the macd line cross above the signal line, which showed a bullish sign in the market. Furthermore, both the lines also entered the positive territory during the second half of the month, sustaining the optimistic sentiment in the market. Towards the end of the month, macd and the signal line ended at 10.86 and 6.47 respectively.
b. RSI
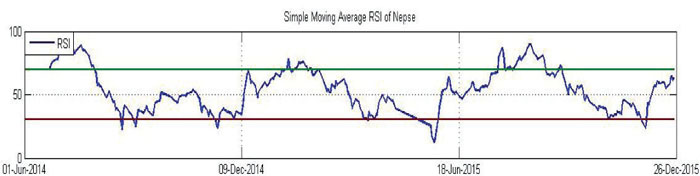
RSI is a form of leading indicator that is believed to be most effective during periods of sideways movement. Such indicators may create numerous buy and sell signals that are useful when the market is not clearly trending upwards or downwards.
RSI at the beginning of the month stood at 23.70 level, which signified a high selling pressure in the market. During the first half of the month, the RSI climbed up at a steep rate. At the second half, it hovered around the late 50’s and early 60’s zone. Moving further up would indicate an overbought condition in the market. In the course of last month, RSI gained 39.24 points to close at 62.94 level.
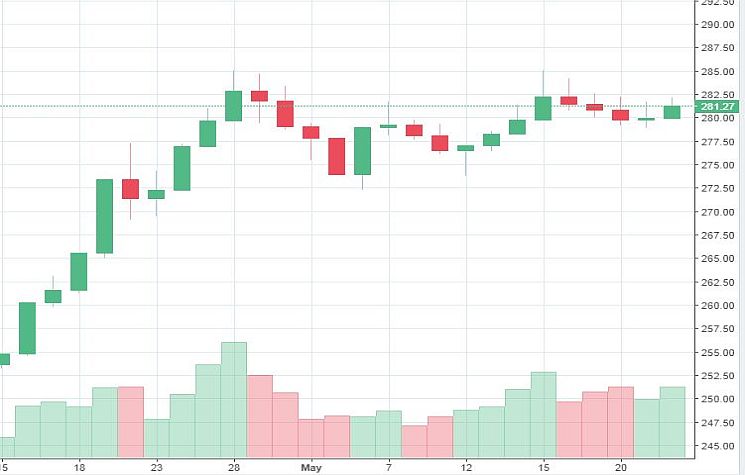
c. Bollinger Bands

The Bollinger Band is a technical indicator that consists of a moving average (21-day) along with two trading bands above (upper band) and below it (lower band). The bands are an indication of volatility, which are represented by calculating standard deviation.
The Bollinger bands also saw significant changes last month. The benchmark index moved up at a steep rate for the first half of the month, where it reached closer towards the upper band, which signified excess demand for securities. For the second half of the month, Nepse hovered between the mid and upper bands. Market volatility has also been on the rise since the past month as the distance between the lower and upper bands have widened.
Volume Indicator (On-Balance Volume)
On-Balance Volume (OBV) is a momentum indicator that relates volume to the current price of the index or security. It measures buying and selling pressure at the market. It acts as a cumulative indicator that adds volume on up days and subtracts volume on down days. If a price increase is supported by OBV, it confirms an uptrend, whereas if a price decrease is supported by OBV, it confirms a downtrend.
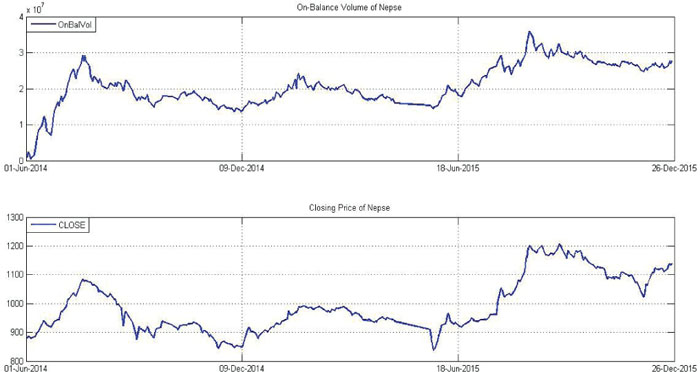
As mentioned last month, the rate of decline experienced by OVB is not as much as compared to that of Nepse, which suggests that the bearish situation in the market does not seem to be as strong to continue in the long-run. The rise in the benchmark index is also supported by a steady increase in the OVB. The average monthly volume transactions increased to NPR 37.43 crores from NRP 20.94 crores the month prior.
Overview
The Nepse index followed a bullish movement in the course of last month. The index gained a staggering 114.26 points (or up 11.17%) to close at 1137.03. It moved above the 50-day moving average as well, supporting the bullish sentiment in the market. The macd crossed above the signal line, and both the lines moved out of the negative territory, signifying a positive outlook of the market. Further rise in the RSI could indicate a possible buying pressure in the market. The Bollinger bands show prevalence of increase in market volatility as the distance between the upper and lower bands are increasing. The new support and resistance level stands at 1130 and 1160 respectively.