Bullish Trend Continues

Nepse Figure

Trend Analysis
The benchmark index scaled up further in the course of last month. Nepse index gained a staggering 67.41 points (or up 5.43%) to close at 1283.52. The index is moving well above the 50-day moving average (MA) and 200-day MA, indicating that the overall market outlook looks good. Investors seem to gain confidence over the slow but steady improvements in the political and economic condition of the country. The surprisingly high Q2 profits of the BFIs, despite slow economic recovery, have triggered a bullish momentum. The index broke all records by reaching an all time height of 1291.81. However, Nepse corrected itself towards the end of the month as investors seem to be moving on to relatively safer bets such as NIB FPO, which started on 11thfalgun. As soon as NRB and SEBON banned NIB’s promoters share holders, big investors, especially insurance companies and mutual fund moved on to others scrips in the secondary market.
Resistance and Support
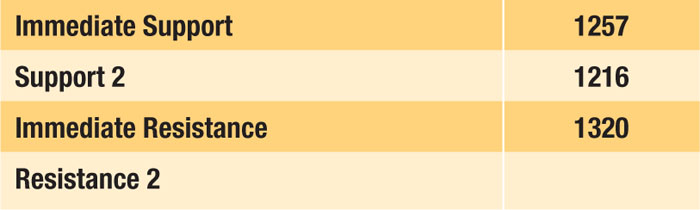
The benchmark index broke the resistance level of 1240 at the beginning of last month. It climbed up to reach a height of 1291.81 towards the end of the month. Currently, the new support and resistance levels stand at 1257 and 1320 respectively. As the market is currently in a bullish run, it could surpass the current resistance level in the course of the coming weeks.
Nepse Trend Indicator
a. MACD
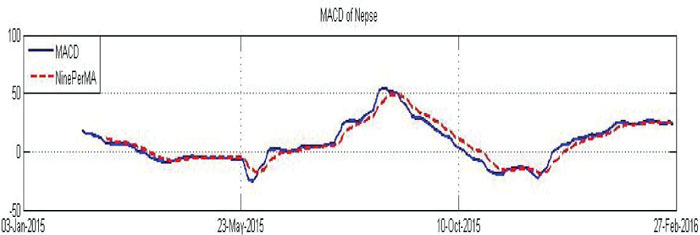
The MACD is a momentum oscillator formed by using two different types of moving averages, which provides specific buying or selling signals. When a MACD line crosses above the signal line, it is considered to be a positive sign and indicates a time to buy, and vice-versa.
The Macd and the signal line, at the beginning of the month, stood at 22.73 and 23.23 respectively. The distance between the lines has remained close, with an average point of 0.26. The macd line remained above the signal line for the first half of the month. Towards the second half, the signal line climbed up the macd line. Macd line and Nepse index have made negative divergence as macd line could not make new high even after Nepse made new high, so Nepse could face correction in coming days as well.
b. RSI

RSI is a form of leading indicator that is believed to be most effective during periods of sideways movement. Such indicators may create numerous buy and sell signals that are useful when the market is not clearly trending upwards or downwards.
RSI at the beginning of the month stood at 76.29 level. In the course of the month, it made a tiny drop by 0.38 points to close at 75.92 level. The RSI stayed at an average level of 81.78 last month, which signifies high buying pressure in the market. However, towards the end of the month, it showed signs of a slowdown in the buying frenzy, which shows a possibility of market correction in the coming weeks.
c. Bollinger Bands
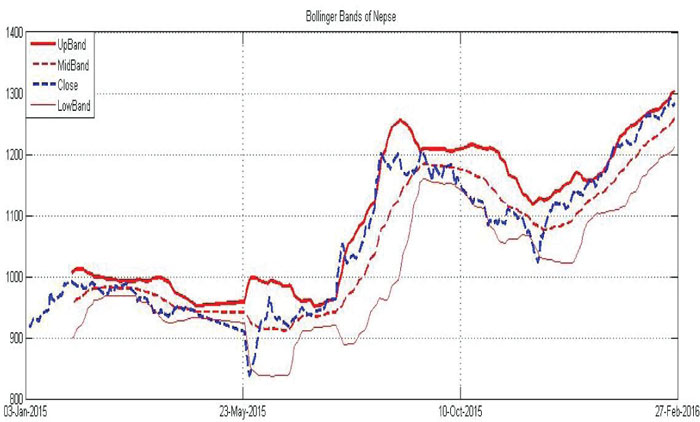
The Bollinger Band is a technical indicator that consists of a moving average (21-day) along with two trading bands above (upper band) and below it (lower band). The bands are an indication of volatility, which are represented by calculating standard deviation.
The benchmark index kept hovering close to the upper Bollinger band last month, indicating over-bought condition in the market. The movement of the bands show a steady climb over the past few weeks, which signifies that the market is in a bullish momentum. The distance between the upper and lower bands remains constant, suggesting moderate market volatility.
Volume Indicator (On-Balance Volume)
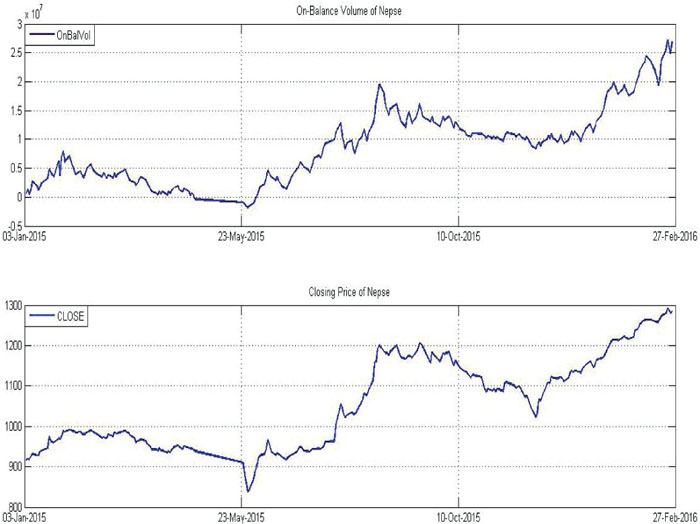
On-Balance Volume (OBV) is a momentum indicator that relates volume to the current price of the index or security. It measures buying and selling pressure at the market. It acts as a cumulative indicator that adds volume on up days and subtracts volume on down days. If a price increase is supported by OBV, it confirms an uptrend, whereas if a price decrease is supported by OBV, it confirms a downtrend.
The OBV (On-Balance Volume) showed more volatility as compared to the movement in Nepse index. The average monthly volume transactions increased significantly to NPR 55.72 crores from NPR 47.89 crores the month prior. Such a rise in the index and the volume indicates that Nepse could possibly continue its bullish trend.
Overview
The above mentioned technical indicators suggest that the benchmark index experienced a bullish momentum in the course of last month as well. However, a steady decrease in the buying pressure is possible in the coming weeks. The index gained 67.41 points (or up 5.43%) to close at 1283.52. The index is moving well above the 50-day and 200-day moving average, indicating the overall market outlook looks good. The RSI continues to signal high buying pressure in the market as it is hovering at 75.92 level. However, the level has been cooling down, which could be a slowdown in the buying pressure. The macd line is still moving very close to the signal line. The Bollinger bands still indicate moderate market volatility. The support and resistance level stands at 1257 and 1320 respectively.
Note:
It was expected that NIB FPO would collect huge money from secondary market. Later as NIBPO holders were banned from applying NIB FPO, institutional investors like mutual fund and insurance company’s investment will return to secondary market, which could increase investment in the banking sector.