Decline Continues
Trend Analysis
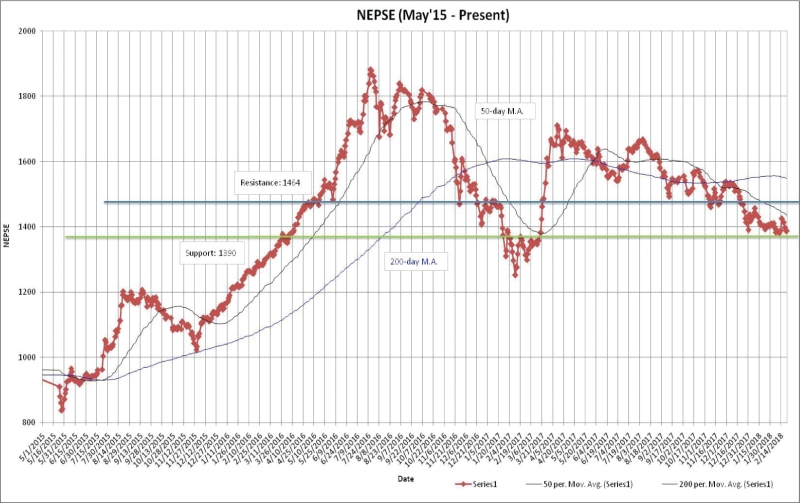
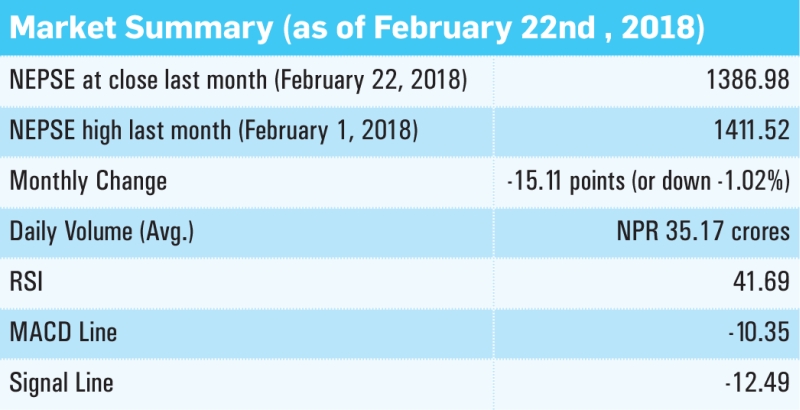
The benchmark index continued its downfall in the course of last month. Nepse declined by 15.11 points (or down 1.02%) to close at 1386.98. The index moving below the 50-day and the 200-day moving average indicates bearish momentum in the market. Additionally, downward movement of the 200-day moving average further supports the bearish sentiment. Favorable political situation did little to trigger a bullish sentiment among investors. The average volume turnover decreased to NPR 35.17 crores from NPR 50.92 crores the month prior.
Resistance and Support
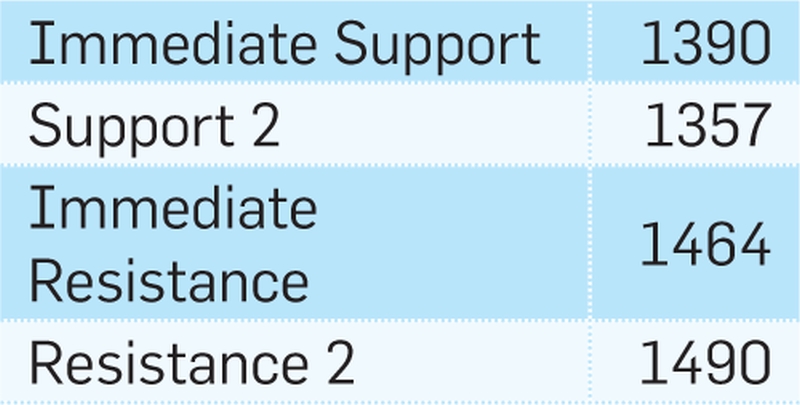
The Nepse index reached as high as 1411.52 on 1st of February. However, with the presence of bearish sentiment, the index reached as low as 1382.02 towards the middle of the month. Currently, Nepse continues to hover around early 1400’s level. The support and resistance level stands at 1390 and 1464 respectively.
Nepse Trend Indicator
a. MACD
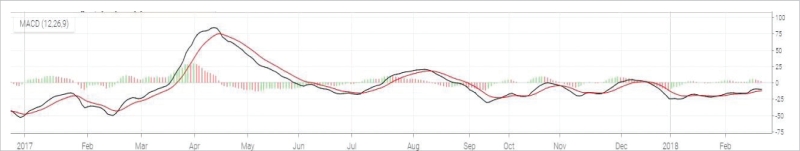
The MACD is a momentum oscillator formed by using two different types of moving averages, which provides specific buying or selling signals. When a MACD line crosses above the signal line, it is considered to be a positive sign and indicates a time to buy, and vice-versa.
The MACD and the signal line, at the beginning of last month, stood at -22.10 and -20.48 respectively. In the course of the month, both the macd and the signal line increased by 11.75 and 7.99 points to close at -10.35 and -12.49 respectively. Both the lines continue to move in the negative territory, showing bearish sentiment in the market. The macd line crossing below the signal line will further indicate a bearish trigger.
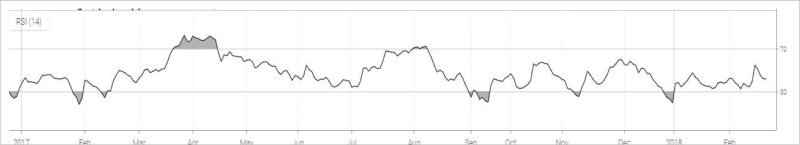
b. RSI
RSI is a form of leading indicator that is believed to be most effective during periods of sideways movement. Such indicators may create numerous buy and sell signals that are useful when the market is not clearly trending upwards or downwards.
The RSI, at the beginning of last month, stood at 32.70 level. In the course of the month, it gained 9 points to close at 41.69 level. The RSI shows a decrease in oversold condition in the market. However, the level remains close to the 30’s zone, which still shows presence of selling pressure.
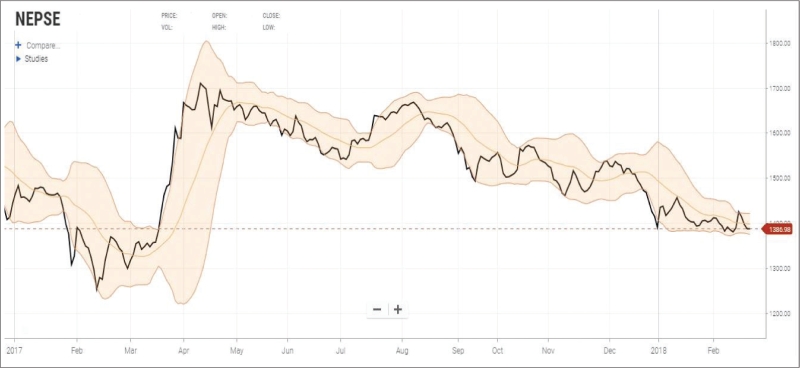
c. Bollinger Bands
The Bollinger Band is a technical indicator that consists of a moving average (21-day) along with two trading bands above (upper band) and below it (lower band). The bands are an indication of volatility, which are represented by calculating standard deviation.
The benchmark index has returned close to the lower Bollinger band from the upper band in the course of last month. The index climbed close to the upper band during the first half of the month, indicating buying pressure. However, the demand did not last as the index fell back towards the lower band, signifying selling pressure in the market. The distance between the upper and lower bands has converged, indicating a decrease in market volatility over the course of last month.
Overview
The benchmark index declined by 15.11 points (or down 1.02%) to close at 1386.98 last month. The index is hovering below the 50 and 200-day moving average, giving a bearish signal. The macd and the signal line are hovering in the negative territory, which gives a bearish sentiment of the market. The RSI closed at 41.69 level, indicating a decrease in the selling pressure compared to the previous month. The bollinger bands indicate a fall in market volatility due to convergence in the upper and lower bands. The support and resistance level stands at 1390 and 1464 level respectively.