In Volatile Phase
Trend Analysis
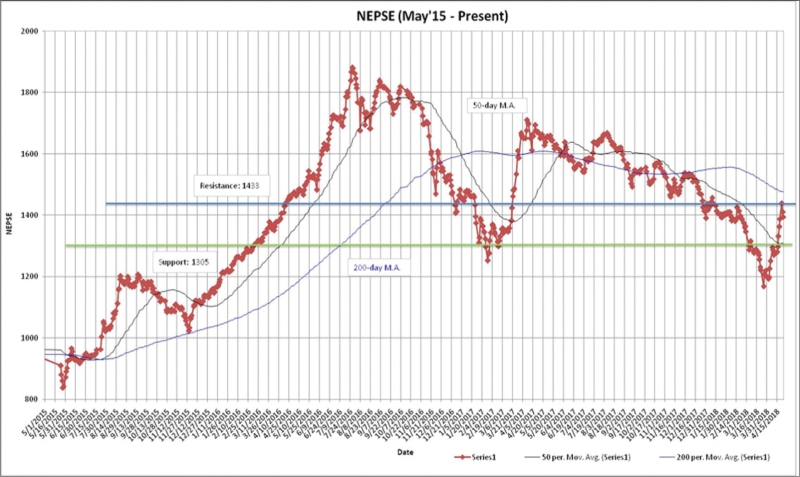
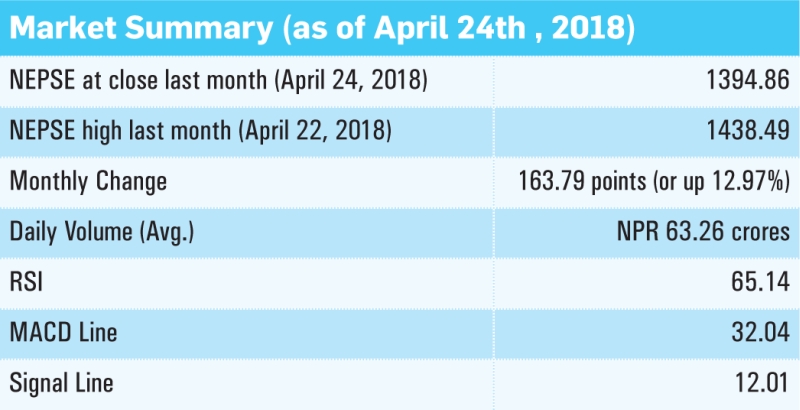
The benchmark index surged up in the course of last month. Nepse increased by a staggering 163.79 points (or up 12.97%) to close at 1394.86. The index crossed above the 50-day moving average, giving a bullish signal. However, the index still remains below the 200-day MA. New investors entering the market, as well as optimism regarding the implementation of online trading platform, has created this bullish trigger. The average volume turnover increased to NPR 63.26 crores from NPR 37.19 crores the month prior.
Resistance and Support
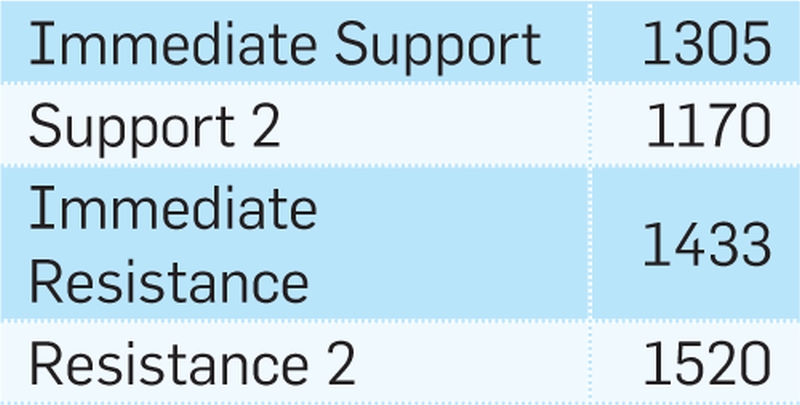
The Nepse index reached as high as 1438.49, breaking all the resistance level in the course of last month. Such movement shows strong bullish momentum. The support and resistance level stands at 1305 and 1433 respectively. With such strong bullish trigger, the index will likely see some corrections in the coming days.
Nepse Trend Indicator
a. MACD
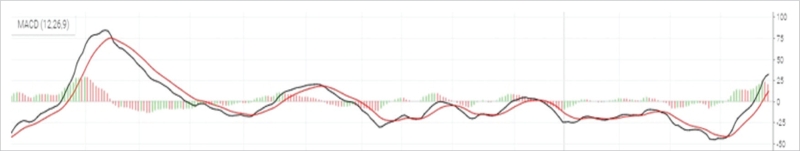
The MACD is a momentum oscillator formed by using two different types of moving averages, which provides specific buying or selling signals. When a MACD line crosses above the signal line, it is considered to be a positive sign and indicates a time to buy, and vice-versa.
The MACD and the signal line, at the beginning of last month, stood at -39.25 and -34.08 respectively. Towards the middle of the month, the macd crossed above the signal line, giving a bullish trigger. By the end of the month, the macd and the signal line increased by 71.29 and 46.09 points to close at 32.04 and 12.01 respectively. The macd indicator shows bullish sentiment in the market.
b. RSI
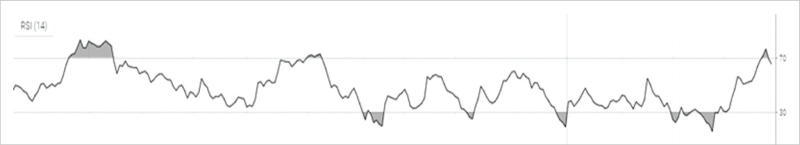
RSI is a form of leading indicator that is believed to be most effective during periods of sideways movement. Such indicators may create numerous buy and sell signals that are useful when the market is not clearly trending upwards or downwards.
The RSI, at the beginning of last month, stood at 31.04 level. In the course of the month, it gained 44.10 points to close at 65.14 level. The RSI shows a rise in buying pressure in the market.
c. Bollinger Bands
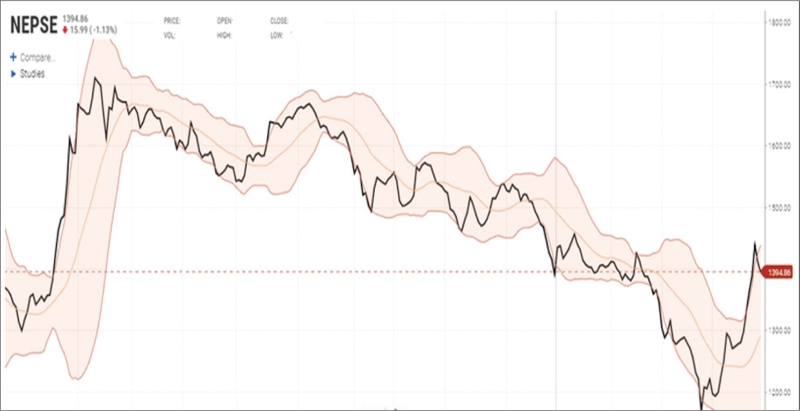
The Bollinger Band is a technical indicator that consists of a moving average (21-day) along with two trading bands above (upper band) and below it (lower band). The bands are an indication of volatility, which are represented by calculating standard deviation.
The benchmark index climbed up and towards the upper Bollinger band in the course of last week. Such an indication also shows an increase in buying pressure in the market. The distance between the upper and lower bands has diverged significantly, indicating an increase in market volatility.
Overview
The benchmark index increased by 163.79 points (or up 12.97%) to close at 1394.86 last month. The index has climbed above the 50-day moving average, giving a bullish trigger. The macd and the signal line are hovering in the positive territory, giving a bullish trigger. The RSI closed at 65.14 level, indicating a rise in the buying pressure in the market. The bollinger bands indicate a rise in market volatility due to significant divergence in the upper and lower bands. The new support and resistance level stands at 1305 and 1433 level respectively.