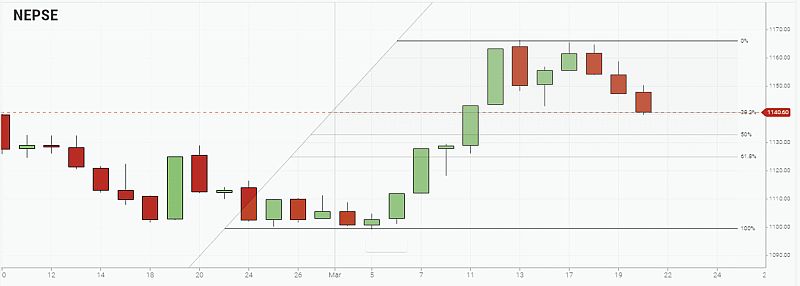
38% Retracement
Trend Analysis
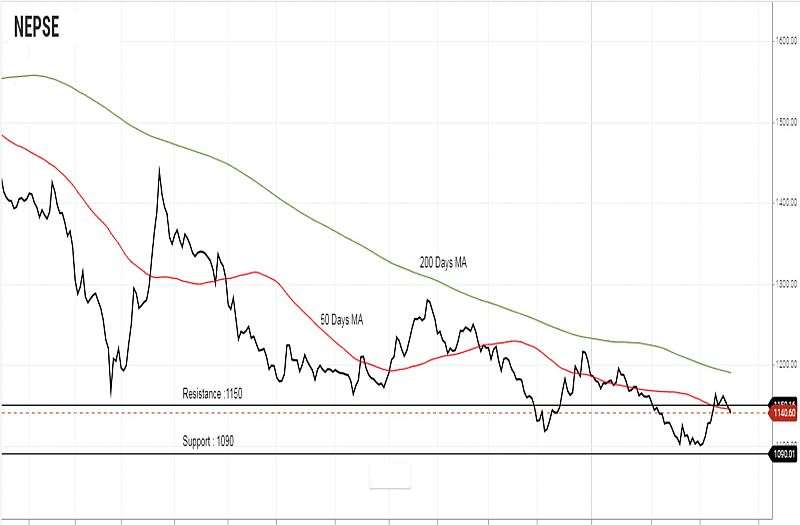
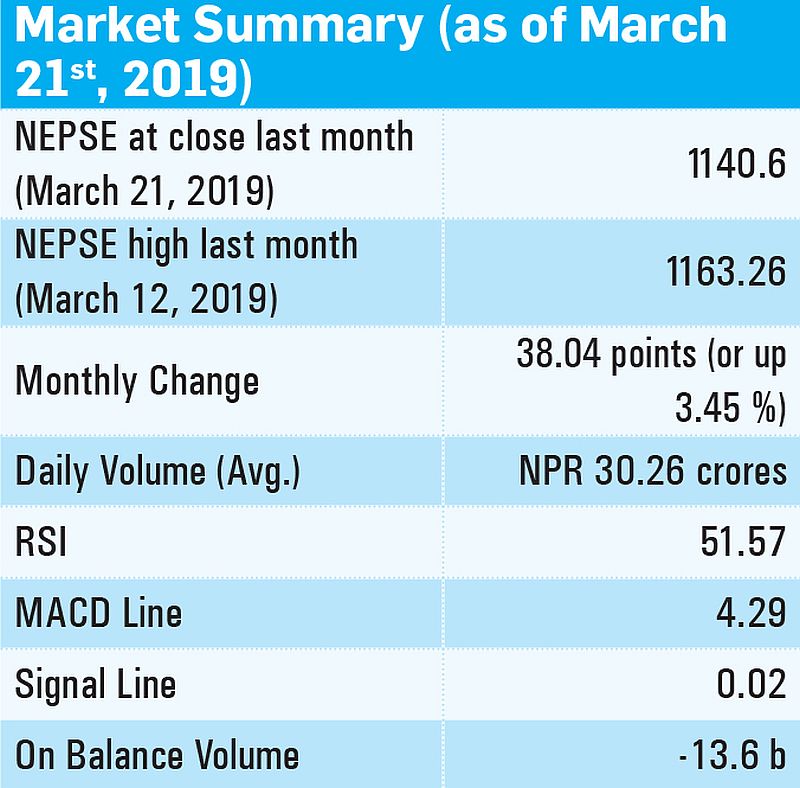
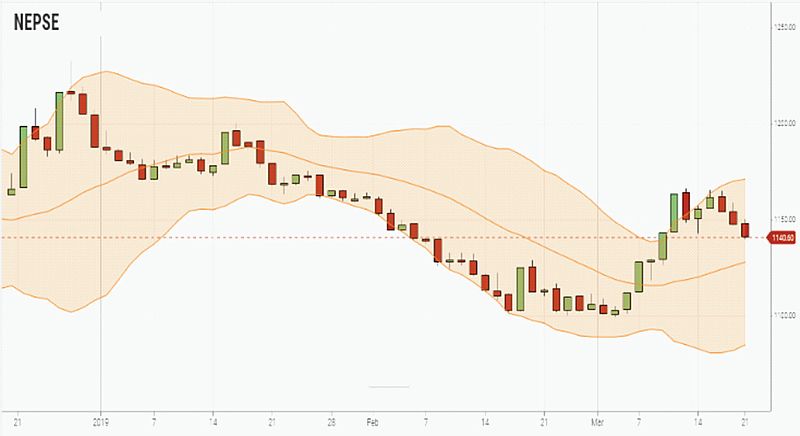
NEPSE gained 38.04 points (or up 3.45%) to close at 1140.6 last month. At the beginning of month, NEPSE showed a bullish momentum breaking the resistance level of 50 days moving average. However, at the end of month, NEPSE broke the support level of 50 days moving average. Currently, NEPSE is trading below the 50 days moving average and 200 days moving average. The average daily volume turnover has decreased to NPR 30.26 crores from NPR 32.25 crores. Currently, NEPSE is trading at the 38.2% of recent upswing from 1100.49 to 1166.27.
Resistance and Support
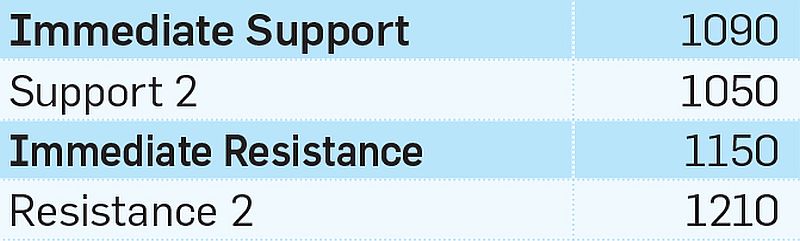
In course of month, NEPSE index showed bullish momentum for most of the days breaking the resistance level of 1150. However, at the end of month, NEPSE broke the support level of 1150 and traded below the 1150 level. The average traded volume was lower than the previous month indicating a decreased market participation. The immediate support and resistance remain same at 1090 and 1150 respectively.
Nepse Trend Indicator
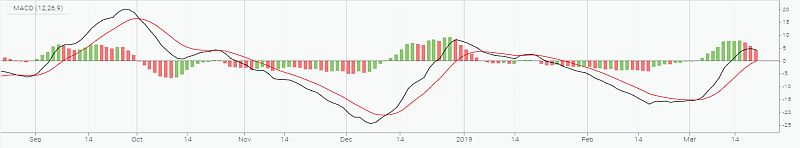
a. MACD
The MACD is a momentum oscillator formed by using two different types of moving averages, which provides specific buying or selling signals. When a MACD line crosses above the signal line, it is considered to be a positive sign and indicates a time to buy, and vice-versa.
The MACD and the signal line, at the beginning of last month, stood at -15.80 and -14.99 respectively. By the end of the month, MACD line and signal increased by 20.08 and 15.009 to close at 4.29 and 0.02. At the beginning of month, MACD line crossed the signal line from the below indicating a bullish crossover in the market. Currently, MACD line and signal line are hovering around the positive zone signifying a bullish sentiment in the market.
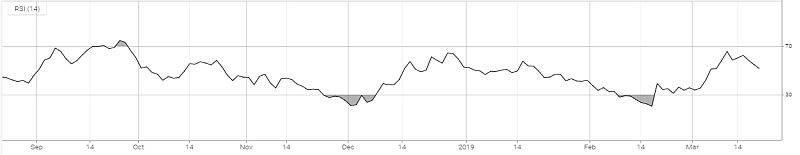
b. RSI
RSI is a form of leading indicator that is believed to be most effective during periods of sideways movement. Such indicators may create numerous buy and sell signals that are useful when the market is not clearly trending upwards or downwards.
The RSI, at the beginning of month, stood at 33.58 level. In the course of month, RSI increased by 17.98 points to close at 51.57. Last month, RSI increased from the 30s zone to the 60s zone indicating an increase in buying pressure in the market. At the end of month, RSI has retraced back to the 50s zone signifying a correction in current market.
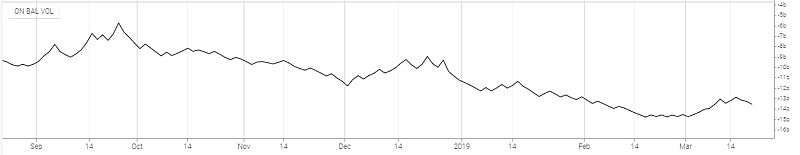
c. OBV
On balance volume is a momentum indicator that uses volume flow to predict changes in stock prices. It measures buying and selling pressure as a cumulative indicator that adds volume in up days and subtracts volume on down days.
The on-balance volume, at the beginning of last month, stood at -14.8 b level. In the course of month, it gained 1.2 b points to close at -13.6 b. Last month, OBV has increased by 1.2 b indicating an increase in buying pressure in the market.
d. Bollinger Bands
The Bollinger Band is a technical indicator that consists of a moving average (21-day) along with two trading bands above (upper band) and below it (lower band). The bands are an indication of volatility, which are represented by calculating standard deviation.
At the beginning of month, NEPSE index traded from the lower Bollinger band to the mid Bollinger band. NEPSE index broke the resistance of mid Bollinger band and traded at upper Bollinger band. At the end of month, NEPSE index traded from the upper Bollinger band to the lower Bollinger band indicating a selling pressure in the market. The distance between the upper Bollinger band and lower Bollinger band has increased indicating a high volatility in the market.
e. Overview
NEPSE gained 38.04 points (or up 3.45%) to close at 1140.6 last month. Currently, NEPSE is trading below the 50 days moving average and 200 days moving average. MACD line and signal line are hovering around the positive zone signifying a bullish sentiment in the market. Last month, RSI increased from the 30s zone to the 60s zone indicating an increase in buying pressure in the market. At the end of month, RSI has retraced back to the 50s zone signifying a correction in current market. Last month, OBV has increased by 1.2 b indicating an increase in buying pressure in the market. The distance between the upper Bollinger band and lower Bollinger band has increased indicating a high volatility in the market. The immediate support and resistance remain same at 1090 and 1150 respectively.