Long Term Still Bearish
Trend Analysis
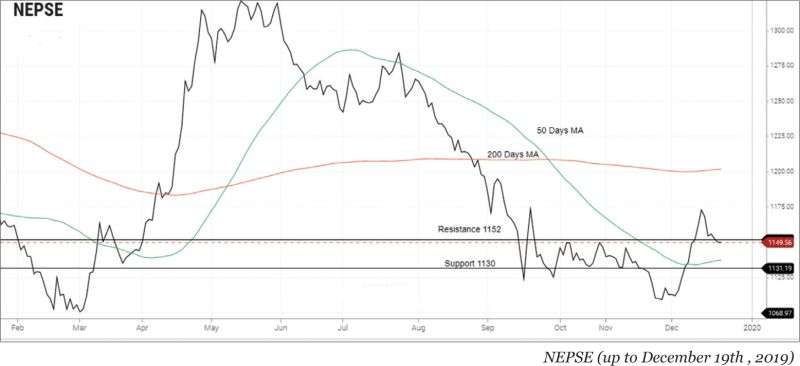
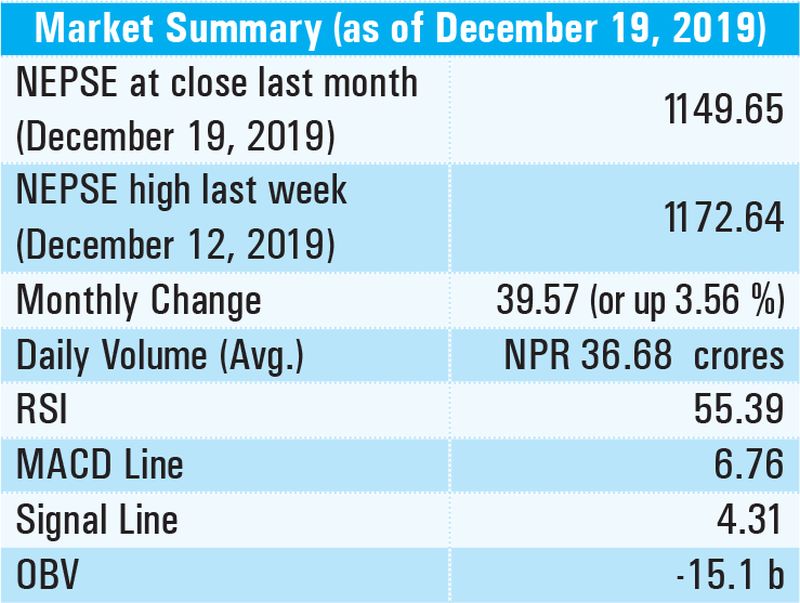
NEPSE index gained 39.57 points (or up 3.56 %) to close at 1149.65 last month. Last month 50 days moving average of NEPSE was crossed from below which showed short term bull. However, NEPSE is trading below 200 days moving average which shows that overall long term sentiment is still bearish. The average volume turnover was NPR 36.68 from NPR 28.62. The increased average volume indicates an increased market participation. Currently, NEPSE is below the support level of 70.6% of recent upswing from 1102.64 to 1349.38.
Resistance and Support
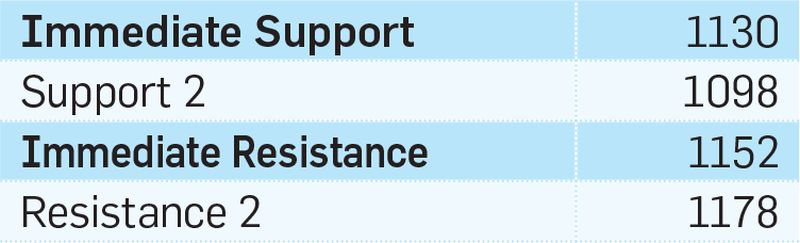
Last month, NEPSE showed a bullish momentum for most of the days. During the course of one month, NEPSE broke the resistance of 1152 for a short period. However, in the last trading day it went just below 1152 making it the immediate resistance at this point. Currently its immediate support and resistance are 1130 and 1152 respectively
Nepse Trend Indicator
a. MACD
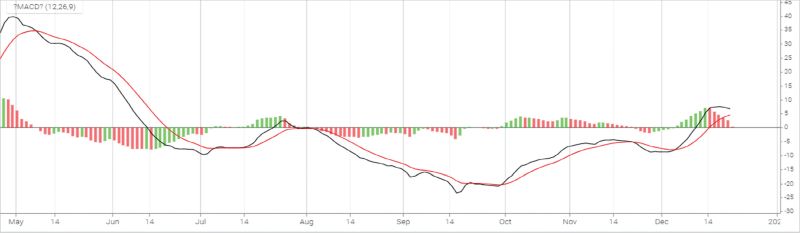
The MACD is a momentum oscillator formed by using two different types of moving averages, which provides specific buying or selling signals. When a MACD line crosses above the signal line, it is considered to be a positive sign and indicates a time to buy, and vice-versa. The MACD and the signal line, at the beginning of last month, stood at -7.38 and -5.99 respectively. By the end of the month, MACD line and signal line increased 14.14 and 10.3 to close at 6.76 and 4.31 respectively. This month, there was a movement of the MACD and signal line in the positive zone indicating bullish signal in the market. However, currently both the signal line and MACD line are moving sideways indicating a decrease in strength of bull signal.
b. RSI
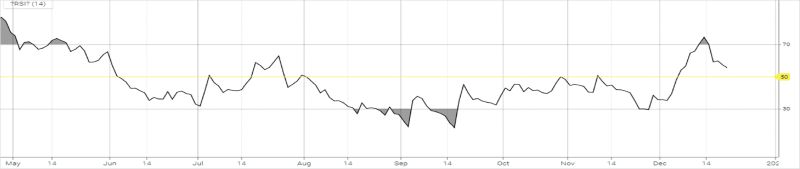
RSI is a form of leading indicator that is believed to be most effective during periods of sideways movement. Such indicators may create numerous buy and sell signals that are useful when the market is not clearly trending upwards or downwards. The RSI, at the beginning of last month, stood at 29.87 level. This month, RSI increased by 25.52 points to close at 55.39. In the course of the month RSI saw a huge momentum as it moved 29.87 level (oversold level) to the 75 level (overbought level) and then to the current 55.39 level (Neutral level). Overall the market has seen high volatility.
c. OBV
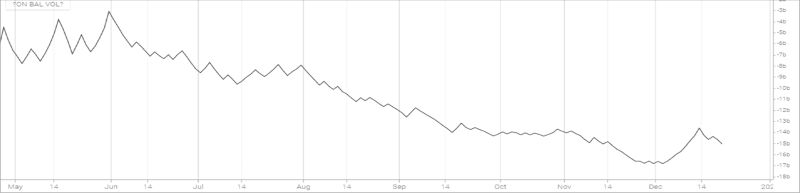
On balance volume is a momentum indicator that uses volume flow to predict changes in stock prices. It measures buying and selling pressure as a cumulative indicator that adds volume in up days and subtracts volume on down days. The on-balance volume, at the beginning of last month, stood at -16.6 b level. In the course of the month, it gained 1.5 b points to close at -15.5 b. The increase in the OBV is mostly attributed to the increase in the buying pressure in market.
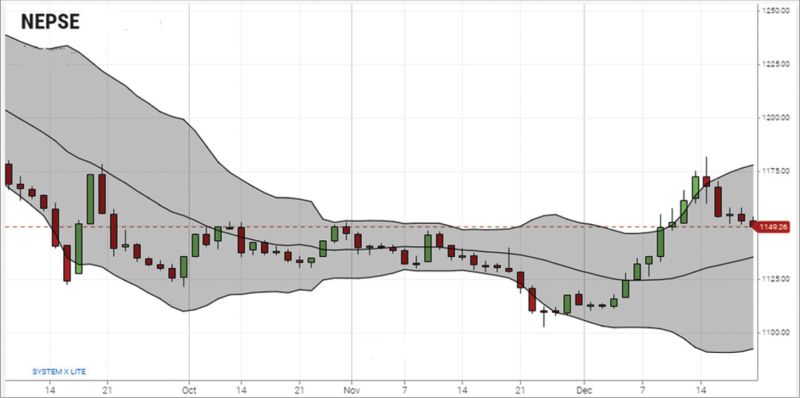
d. Bollinger Bands
The Bollinger Band is a technical indicator that consists of a moving average (20-day) along with two trading bands above (upper band) and below it (lower band). The bands are an indication of volatility, which are represented by calculating standard deviation. At the beginning of last month, NEPSE index traded from the lower Bollinger band to the upper Bollinger band breaching the resistance level of mid Bollinger band. The distance between upper Bollinger band and lower Bollinger band has increased indicating a high volatility in the market. NEPSE traded mostly at the mid-level Bollinger band for most of the time indicating a Nepse reverting back to the Mean. The distance between upper Bollinger band and lower Bollinger band has decreased indicating a lower volatility in the market.
e. Overview
NEPSE index gained 39.57 points (or up 3.56 %) to close at 1149.65 last month. NEPSE is below the support level of 70.6% of recent upswing from 1102.64 to 1349.38. Currently its immediate support and resistance are 1130 and 1152 respectively. This month, there was a movement of the MACD and signal line in the positive zone indicating bullish signal in the market. The increase in the OBV showed buying pressure. The distance between upper Bollinger band and lower Bollinger band has increased indicating a high volatility. The average traded volume had increased than the previous month indicating an increased market participation.