By Bikram Chitrakar
(Review for 25 November to 24 December, 2012)
December 2012 saw Nepal’s stock market reach nearly three years’ high and the bull run is continuing also in January 2013. The benchmark Nepse index stretched 28.31 points or 5.39 per cent during the review period between November 25 and December 24 to close at the session’s high of 525.67 while the session’s low was on December 3 with 481.94. The previous high was at 524.19 recorded on 18 January, 2010.
Fall in the banking interest rate and the liberal attitude of banks in extending loans for the purchase of shares from the secondary market have contributed to pull the investors toward the secondary market. The significant growth in the turnover shows the growth in the number of investors in the market.
One important development of the month was New Fund Offer (NFO) by Siddhartha Capital. The scheme, named Siddhartha Investment Growth Scheme-I, is worth Rs 400 million with 5 years maturity. Another similar development was the issuance of IPO by Civil Bank; the bank floated eight million units of general shares. Both these offers in the primary market were lapped up by the investors. Still the secondary market continued its upward journey providing further proof to both of the claims of the analysts that the market is getting new investors and that the existing investors have regained their optimism.
The recent acceleration has been underpinned by the same fundamentals that govern the sentiments of Nepali investors. Timely settlement of the present political chaos will certainly drive the market higher irrespective of the resistance that can be expected at this level.
Performance by Sector
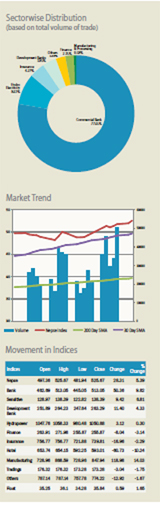
The manufacturing sector, led by Unilever Nepal, posted a whopping gain of 118.98 points or 14.03 per cent to reach 847.94. The commercial bank sector that holds a very high share in the market added 50.36 points or 9.82 per cent to settle at 513.05. Similarly, the development bank sector accelerated 11.40 points to 263.29 while the hydropower sector surged 3.12 points or 0.30 per cent to rest at 1050.88. However, the hotels sector plummeted 60.73 points or 10.24 per cent to 593.01. Likewise, the insurance sector lost 16.96 points and the ‘others’ sector 12.92 points to settle at 739.81 and 774.22, respectively. The finance sector descended 8.04 points or 3.14 per cent to settle at 255.87.
The sensitive index that measures the performance of 133 blue chip scrip at the secondary market moved 9.42 points or 6.81 per cent up to 138.39 while the float index calculated on the basis of real transaction escalated 0.59 points or 1.65 per cent to 35.84. A total turnover of Rs 2,391,327,495 was realized during the review period through the trading of 6,746,527 units of share traded via 29,146 transactions.
The accompanying figure depicts the sector-wise distribution based on the total volume of trade. As usual, the commercial bank sector grasped 77.65 per cent of the total volume of trade. The hydropower sector occupied 8.61 per cent, insurance sector 4.27 per cent and the remaining sectors made up for the rest.
Technically, the Simple Moving Average (SMA) in both long term and short term is dominated by the Nepse. Both, 200 days SMA and 30 days SMA are outcast with straight ascending of the index, while testing of resistance level is intact at this level.
Chitrakar is a Stock Analyst with Jamb Technologies Pvt Ltd.